

It takes a village
Have you noticed the growing trend of planned urban developments in cities? These are neighborhoods intentionally designed so that housing, dining, entertainment, shopping, and even workspaces are all within walking distance.

This approach is becoming increasingly popular because it not only offers convenience for residents, but also helps reduce overcrowding in other parts of the city, by creating new amenities to support these communities.
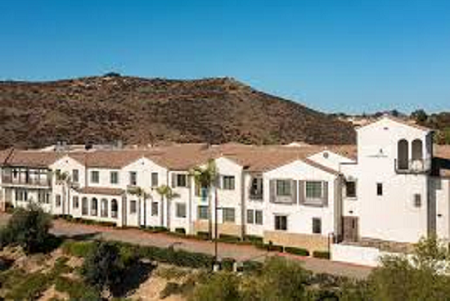
With the silver tsunami of Baby Boomers hitting retirement age – coupled with the alarming rates of dementia and Alzheimer’s Disease on the rise – the Dutch have created an attractive alternative to standard assisted living facilities using the model of a planned community.
Here in the United States, I am familiar with a special form of assisted living called residential assisted living, which uses regular looking houses you would see in any kind of neighborhood.
My mom was fortunate enough to live in one for several years. Driving by that house, you would never know that six seniors lived there – each one surrounded by their own possessions in their own room – and being cared for by staff 24/7.

The Dutch have taken the residential care concept – and that of planned urban developments – to a whole new level.
In this plan, all homes have six residents who need assisted living for dementia care. With fewer people and activity, a calmer home-like atmosphere is created.

As a former RN working in long term care facilities, I can remember how difficult it was for our confused patients to negotiate long, sterile corridors, and to take their showers in large, cold, tiled shower rooms, where sounds echoed off the walls – only adding to their agitation, confusion, and fear.

The creators of this dementia village in the Netherlands value their residents as people with goals and aspirations, not just people with a diagnosis of dementia.
Want to go for a walk? The pathways are safe; there is no way to get lost, and the perimeters are secure.
Want to go to a restaurant, a store, or the movies? The staff in each are trained in dementia care and know what to do.

They have created their own care village!
This is such a commonsense approach to a growing concern around the world. Part of the hesitancy of families to use long-term care involves the institutional feel of facilities. A village of homes with safe access to amenities just a walk away, honors the residents and can give comfort to the families.

Maybe some of our FoodTalk4You readers know of people in urban planning and long-term care planning who could study this approach.
In health –
Deidre
That’s our cue to share this post using the options under the MORE button below.